Overall, 30 individual participants walked 58 walks. The walks included:
- 42 verified walks using the app (the participants answered the questions while being physically on site and walking the walks)
- 3 walks done using paper-based instructions and surveys
- 13 walks for which the participants retrospectively input the data using the app.
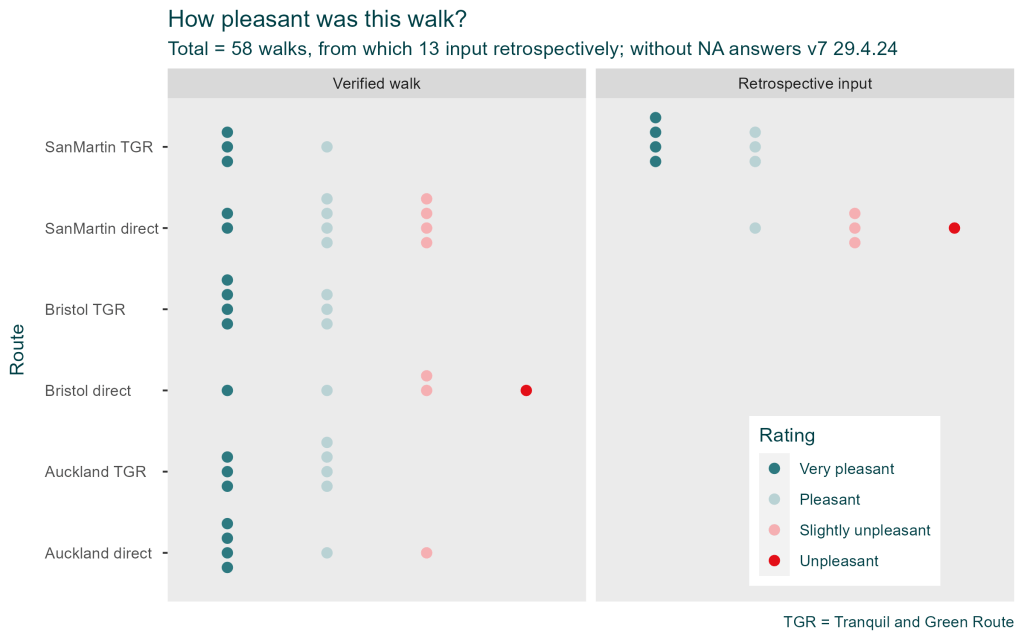
Experienced pleasantness
Participants were asked to rate the pleasantness of the walk as well as the perceived safety regarding traffic, and personal safety. Regarding pleasantness , 39 of the 51 rated walks were perceived as pleasant or very pleasant, with 12 being seen as slightly or very unpleasant. None of the tranquil and green routes was rated as unpleasant.
Qualitative analysis of open-text inputs
The optional survey invited participants to provide insights on (a) the difficulties they might have experienced along the walk; (b) the aspects they enjoyed; and (c) the aspects they did not enjoy. Open text entries were coded qualitatively to identify the topics, i.e. features referred to. The coding was done separately by three researchers, for the inputs for Auckland and Bristol (in English). The comparison of the results showed a good level of agreement with minor differences relative to the level of granularity (e.g. “walking environment” instead of “crossing facilities”). After agreement on the codes and the level of detail, the coding for San Martin (in Spanish) was done by CG and LV and reviewed by TB. The codes obtained were grouped into categories where relevant, so to aggregate similar concepts, especially for codes mentioned only by one participant. The categorisation was not forced – for instance, one person enjoyed seeing a landmark, and this input was kept as a category on its own because it was conceptually distinct from other codes. The results from the 32 inputs to the optional survey are presented below (each input corresponds to one walk; the number of unique respondents is not known because the survey was anonymous).
Difficulties encountered
Only four inputs mentioned difficulties. Three inputs were from San Martin, mentioning difficulties crossing (2) and footway obstructions (1). The fourth input was from Bristol and related to the in-app instructions, which were perceived as not clear enough.
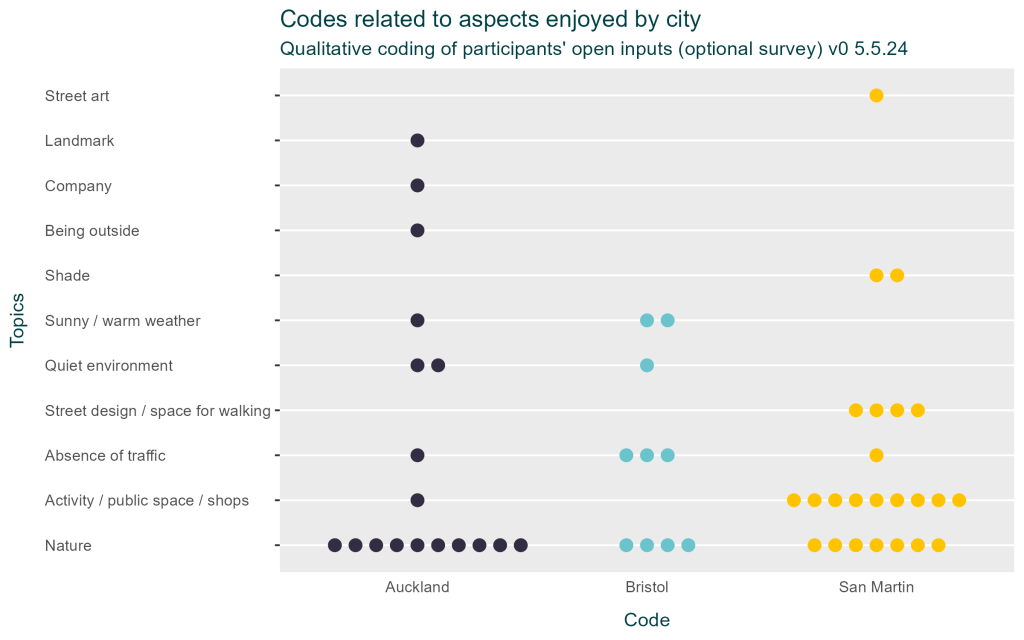
Aspects enjoyed
The aspects enjoyed by city are presented below. Nature was by far the leading topic, with 21 mentions. This category includes references to trees, greenery, views of the water (Bristol’s tranquil and green route follows an urban canal), and birds.
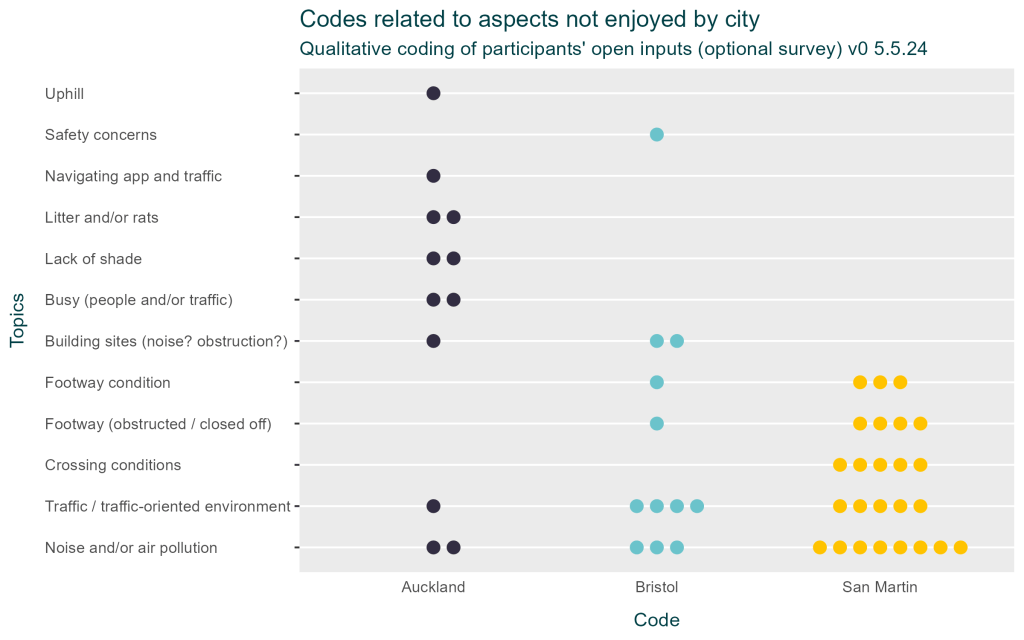
Aspects not enjoyed
The aspects not enjoyed are presented below. The top two topics were: (a) Noise and/or air pollution (13 mentions, 8 of them in San Martin) and (b) traffic and traffic-oriented environment (10 mentions, of which 5 in San Martin). The two aspects were related, some participants talking specifically of traffic noise. Air pollution is also probably linked to traffic and heavy vehicles although these were not explicitly noted.
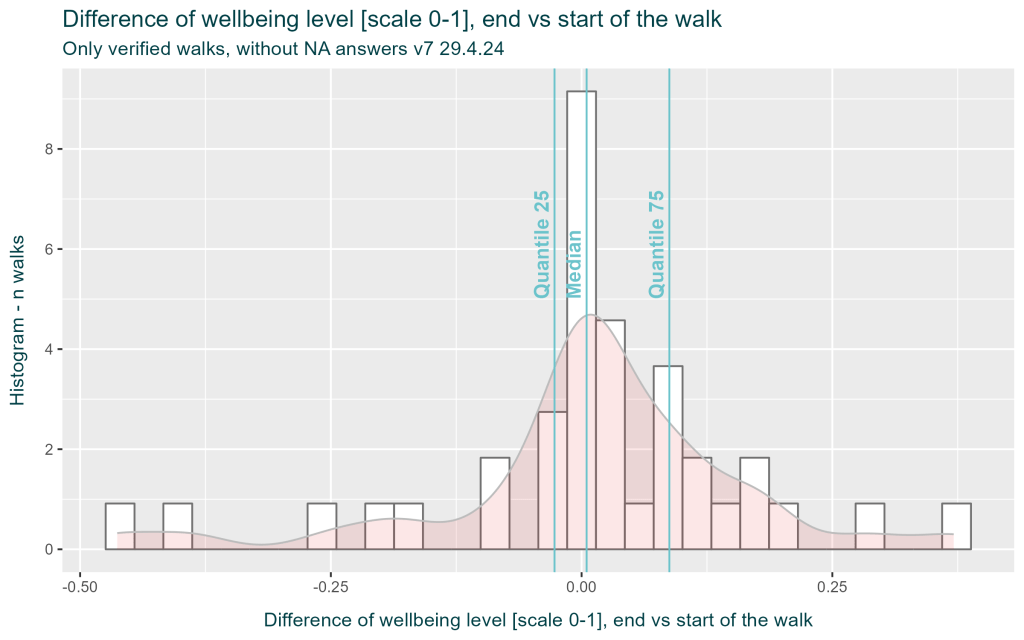
Overview of perceived wellbeing
The level of wellbeing was asked at the start and at the end of each walk (slider input recorded as a continuous variable between 0 and 1). The difference was calculated for each walk and is presented below. The distribution is centred on zero, suggesting no significant changes in wellbeing, and most values are between -0.15 and +0.15). There appears to be no notable difference in change in wellbeing, comparing between the direct and tranquil and green routes across the cities). The comparison of changes in wellbeing between the two routes, for single participants, was not calculated, in reason of the low number of participants who walked both routes.
Testing machine learning to test associations between environment and experiences
Using machine learning was trialled to understand whether the two outcome variables could be predicted, based on the environmental data (including results from modelling and qualitative observations). The small data set oriented the analysis towards attempting to fit simple decision tree models, done in an exploratory way, i.e.: to identify variables and thresholds that could be associated with routes being perceived as ‘very pleasant’ or wellbeing being improved.
A decision-tree based approach was tested to predict binary outcomes (e.g.: wellbeing increased or not). Even simple models’ results are impacted by the small sample size: considering the 39 verified walks for which the pleasantness was informed, the training set is made of 31 walks and the testing set of 8 walks.
Machine learning allowed screening through the large set of variables and identifying those that could have some signal in predicting outcomes.
For pleasantness of walking, the variables of interest were the quantitative assessment of traffic noise (median Lday ≤ 71 dBA) and the qualitative assessment of the condition of green infrastructure (rating ≥4/5).
Surprisingly predicting increased wellbeing appeared easier: accuracy was >70% in 96 out of the 100 tested models, and all of them were based only on modelled traffic noise being not excessive (median Lday ≤ 71 dBA).

Leave a comment